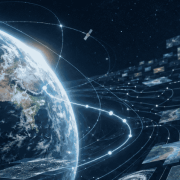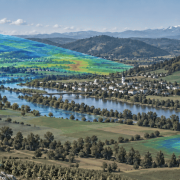
Satellite, drone and ground-based sensors collecting complementary measurements over a European river valley, with highlighted areas showing the different observation scales.

No single source tells the whole story: why satellite data often works best when combined with other observations

Satellite technology is remarkably advanced, so it is tempting to imagine it can see almost anything, anywhere, in perfect detail, at any moment. In reality, satellites have real limits.

Most Earth Observation satellites follow predetermined orbits, which limit when they can observe a particular location. Some can be tasked or pointed towards a target, but acquisitions are still constrained by their orbit, capacity and revisit time. Thick cloud cover can prevent optical instruments from observing the surface, while thinner clouds and haze may reduce data quality. Radar can image the surface through most cloud cover and operate day or night, although intense precipitation can affect some radar observations, depending on the wavelength and application. Satellite instruments also generally involve trade-offs between spatial detail, coverage and revisit frequency: a single sensor cannot provide the finest detail, the widest coverage and the most frequent observations all at once.

This is why satellite data is often combined with measurements taken on the ground or from other observing systems, including ground stations, buoys, weather balloons, aircraft and other sensors. Each source provides a different kind of information. Local observations can reveal details that a satellite may not capture, while satellites are particularly valuable for providing broad, repeated and relatively consistent observations across entire regions.

What follows are examples of the same principle: other sources can help validate satellite-derived information, fill observation gaps or provide the context needed to interpret what a satellite detects.

Satellite and ground station: wide coverage, verified on the spot

Soil moisture is a good example.

Satellites can estimate moisture levels across extensive areas, including places where installing and maintaining instruments on the ground would be difficult. This broad and consistent coverage is one of their main advantages.

A satellite measurement, however, is not the same as placing a sensor directly in the soil. Satellite soil moisture products are derived from signals recorded by the instrument and processed through models. Their accuracy is therefore assessed through comparisons with in-situ measurements, field campaigns and other reference datasets, while accounting for the very different spatial scales involved.

Networks of ground stations remain essential for validating satellite products and improving the methods used to derive soil moisture estimates.

The satellite supplies broad coverage; the stations provide local, in-situ measurements.

Satellite and drone: complementary views during emergencies

During an emergency, the timing of an observation can be as important as its resolution.

Optical satellites cannot observe the surface through thick cloud cover. Radar satellites can, although their imagery has a different geometry and provides a different type of information that may not be suitable for every assessment.

Aircraft and drones can sometimes help. They can be deployed more flexibly and, in suitable conditions, collect very high-resolution imagery below the cloud layer, provided visibility and flight conditions remain suitable. The Copernicus Emergency Management Service has also introduced an aerial component to complement satellite-based mapping in selected emergencies.

Aircraft and drones, however, are not available in every situation. Their use depends on weather, visibility, safety, local regulations and the time needed to organise a flight. Drones, in particular, may be unable to operate in heavy rain or strong winds, the very conditions that often cause the emergency in the first place.

Still, when conditions permit, aerial observations can fill an important gap. In a rapidly changing emergency, an image delivered while decisions are being made may be considerably more useful than one acquired after the situation has changed, without ever reducing the value of the satellite’s own, wider view of the same event.

Satellite and organisation: scale meets context

Not every useful source belongs to a scientific monitoring network. Organisations already hold information that can change how satellite observations are interpreted.

A farm may have records of irrigation, crop varieties and previous yields. A water utility knows how much water it pumped, from which infrastructure and at what time. An infrastructure operator may hold records on the location, condition and maintenance history of roads, pipelines, railways or other assets.

Satellite observations can show patterns across a large area, such as changes in vegetation, surface temperature, soil moisture or ground stability. Internal records help explain what was happening on the ground at the same time.

A change in vegetation observed from space may be linked to water stress, but irrigation records, field observations and weather data can help investigate why it occurred. For an infrastructure operator, information on ground movement or flooding becomes more useful when it can be connected to the location and condition of specific assets.

Satellite data provides scale and consistency; operational data can supply the local context needed to interpret it and decide what to do next.

Sharper satellites, same need for company

Satellite imagery is becoming more detailed and, in many cases, more frequent. Copernicus, the European Union’s Earth Observation programme, complements Sentinel data with observations from contributing missions operated by commercial providers, ESA Member States and other international partners, including high- and very-high-resolution optical and radar missions.

These developments are closing some observation gaps. A growing constellation may revisit an area more often, while a higher-resolution instrument can reveal features that older missions could not detect.

Better imagery does not, however, make ground measurements, aerial surveys or operational records redundant. A sharper image may show where a change occurred, but not necessarily what caused it, whether it affected an organisation’s assets or what response is appropriate.

The aim is therefore to choose the combination of sources that fits the problem.

Reading different data side by side

Combining data is not simply a matter of displaying several datasets on the same screen.

Measurements may cover different areas, represent different moments in time or use incompatible formats and units. A satellite measurement may represent a relatively large area and be updated every few days, while a ground sensor records a single location every few minutes. Both may be accurate, but they are not describing the world at the same scale.

The sources may also have different levels of accuracy and uncertainty. Before they can be used together, these differences have to be understood and taken into account.

This requires suitable processing and knowledge of the phenomenon being monitored. Some steps can be standardised, but the method still has to reflect what the data represents and what decision it is expected to support.

The important question is not simply which satellite can cover a particular case, but which combination of observations can provide the information actually needed. Each example in this article illustrates the same principle: different sources reveal different parts of a problem. Making them work together reliably is a distinct skill, one that sits between the data itself and the decision it is meant to support.


This article is part of EOReach, a Progressive Systems initiative created to bring Earth Observation data, tools and knowledge into a wider range of application domains.

At Progressive Systems, we support this process through EarthConsole®: helping organisations combine satellite observations with other sources of data and turn them into operational digital services for environmental and climate monitoring. If you are working on a similar challenge, we would be happy to discuss it with you. Contact us at info@earthconsole.eu.


Sources

ESA Space Solutions, “Newcomers Earth Observation Guide.” https://business.esa.int/newcomers-earth-observation-guide

ESA Climate Change Initiative, Soil Moisture project. https://climate.esa.int/en/projects/soil-moisture/related-links/

European Commission Joint Research Centre, “Drones and planes: unprecedented imagery resolution for disaster assessment.” https://joint-research-centre.ec.europa.eu/jrc-news-and-updates/drones-and-planes-unprecedented-imagery-resolution-disaster-assessment-2023-09-25_en

ESA, “19 New Space signatures for Copernicus Contributing Missions.” https://www.esa.int/Applications/Observing_the_Earth/Copernicus/19_New_Space_signatures_for_Copernicus_Contributing_Missions
FLEX and Sentinel-3C: watching plants breathe and tracking a changing planet

Today, two satellites lifted off together from Europe’s Spaceport in French Guiana. One is there to watch plants breathe. The other will continue monitoring key environmental and climate variables, building on observations collected by its predecessors since 2016.

They will help us better understand the health of vegetation and the wider conditions shaping our changing planet.

Two satellites, one launch

The two satellites are FLEX, a new ESA Earth Explorer mission, and Copernicus Sentinel-3C, the third satellite in Europe’s Sentinel-3 series. They travelled into space aboard the same Vega-C rocket, using a specially designed configuration that allowed them to be released separately.

FLEX: watching plants breathe

FLEX carries FLORIS – the Fluorescence Imaging Spectrometer – an instrument designed to detect something the human eye cannot see: the faint glow emitted by plants as they photosynthesise.
This signal changes according to a plant’s health and growing conditions. It can reveal early signs of stress caused by drought, heat or disease, sometimes before they become visible in a field.

On its own, however, this signal tells only part of the story. To interpret it correctly, scientists also need information about factors such as land-surface temperature, vegetation type, clouds and atmosphere. These are among the variables already measured by Sentinel-3.

Now in space, FLEX will fly in tandem with Sentinel-3A satellite already in orbit, and later on with Sentinel-3C. Together, their measurements are expected to give scientists a far more complete picture of how vegetation is functioning across the planet.

Sentinel-3C: continuing the watch

Copernicus Sentinel-3C, jointly managed by ESA and EUMETSAT, is the third satellite in a series that has been operating since 2016. Its role is not simply to introduce new observations, but to help ensure that an essential monitoring service continues without interruption.

Its instruments support a wide range of applications. They measure sea-surface temperature, ocean colour, wave height, wind and changes across land and ice. These observations may contribute to weather and ocean forecasts, safer navigation, the early detection of harmful algal blooms, and the monitoring of active fires, just to mention a few.

Why long-term observations matter for our changing planet

Across Europe, the effects of a changing planet are becoming increasingly visible through extreme heat, wildfires, prolonged droughts and rising sea levels. The ocean plays a central role in these changes, absorbing roughly 90% of human-driven heat, shielding us from either grater impacts of global warming.

This process is already reshaping currents, ecosystems and weather patterns.

At the same time, around 30 million people in Europe live in coastal flood plains exposed to sea levels rise.

Changes of this scale cannot be understood from a single snapshot. They require the same measurements, collected consistently over many years. This is why keeping the Sentinel-3 series operating without interruption matters.

A single observation can tell us what is happening today. A long, continuous record can help a coastal community, fishing fleet or planning authority understand whether a particular year was unusual or whether it signals a lasting shift.

And through the Copernicus programme, much of this data is made freely available, often within hours of being collected, so that researchers, public authorities, businesses and other organisations can turn observations from space into practical information.

This article is part of EOReach, a Progressive Systems initiative created to bring Earth Observation data, tools and knowledge into a wider range of application domains.

Through our EarthConsole® platform, we help researchers, public authorities, businesses turn data and analytical models into operational digital services for environmental and climate monitoring. If you would like to explore how Earth Observation data could support your work, contact us at info@earthconsole.eu.

Image credit: ESA/ATG medialab


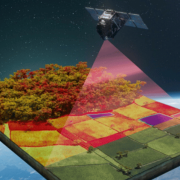
Earth surrounded by layered satellite imagery and geospatial data, with a luminous path emerging through the complexity.

So much Earth Observation data, so hard to choose

The people we have been working with most closely are researchers: scientists who use Earth Observation data professionally, some for their entire careers. If anyone should feel at home navigating this domain, it is them.

Yet the difficulty they have been describing to us, more and more often, has nothing to do with a lack of data or a lack of skill. It comes down to orientation: knowing which of the many satellite missions carries the measurement they need, on which platform it lives, in what format, under what conditions. The information exists. Finding it has turned into a task of its own.

That tells the rest of us something. If people who work with Earth Observation data every day find this hard, imagine someone approaching satellite data for the first time, with no idea where to start. So when a company or a public administration looks at this world and feels lost, that is not a sign of falling behind. It is an accurate read of how complicated the Earth Observation data landscape has gotten.

The Earth Observation data landscape really has grown

A few numbers, so this doesn’t stay just an impression.

According to the 2024 edition of the Earth Observation Satellite Systems report by Novaspace, a space-sector market intelligence firm, around 1,900 Earth Observation satellites were launched in the decade to 2023, and the forecast for the following decade (2024 – 2033) is roughly 5,400, nearly three times as many. Each new satellite mission brings its own instruments, its own data products and archives, and usually its own way of accessing them.

Access to satellite data itself has opened up a lot, at least in Europe. Most of the data and information produced by Copernicus, the EU’s Earth Observation programme, is available to anyone in the world, free of charge and without restriction. Since June 2024, European rules also require public bodies to publish key categories of geospatial data, from environmental to meteorological and mobility data, at no cost and in machine-readable formats.

All of this adds real value to the Earth Observation ecosystem. It also adds one more door to keep track of.

What all those doors lead to

Behind those doors sits a surprising amount of possibility, and a lot of it costs nothing to access.

A municipality can use Earth Observation data to track how heat builds up across its streets and plan green spaces accordingly. A farm can use satellite data to catch water stress in a field before it shows to the eye. Someone monitoring railway infrastructure can use remote sensing to pick up ground movement of a few millimetres a year. None of this is hypothetical, it is what Earth Observation data already allows today.

Which is precisely why struggling to find your way through it matters. If there were little on offer, getting lost wouldn’t cost much. The more this landscape has to give, the more expensive it gets to not know how to navigate it.

How the industry is tackling satellite data fragmentation

The organisations that produce and manage Earth Observation data see the same problem, and several are trying to do something about it.

In Europe, the clearest example is the Copernicus Data Space Ecosystem, launched in 2023 as the official gateway to Copernicus satellite data. One place to search, view, download and process satellite data, replacing a handful of earlier access points, now hosting tens of petabytes of data for a community of hundreds of thousands of registered users.

ESA is pursuing a different route toward the same goal. Its Common Architecture initiative, known in the sector by its technical name EOEPCA+, starts from much the same observation as this article: that the ecosystem of Earth Observation platforms has become fragmented, leaving users with too much to evaluate on their own. Instead of gathering everything under one roof, the initiative works on shared technical standards, developed together with the sector’s main standards body (the Open Geospatial Consortium), so that tools and platforms built by different providers can still work together instead of locking users into one system.

Why navigating satellite data matters as much as having it

Put the growth of the landscape and these efforts to organise it side by side, and a pattern emerges: access to satellite data is no longer the main obstacle, at least not for most of what this article has described. What makes the difference is the ability to navigate it well, to connect one specific question to the right sources out of thousands.

What should that navigation look like, going forward? A single gateway is one answer. Common standards are another. Someone who deeply knows the Earth Observation terrain and can guide you through it might be a third. It will probably take some mix of all of them. In the meantime, we’re curious to hear, where do you get lost in the Earth Observation data domain?

This article is part of EOReach, an initiative by Progressive Systems to bring Earth Observation data, tools and knowledge into any application domain. If you are interested in exploring how EO data can support your domain, you can contact us at info@earthconsole.eu. 

Sources

How Europe’s fire data got three times faster, without a single new satellite

This summer, while large areas of countryside in many European countries dealt with wildfires, something changed in the way satellite data reaches the people who respond to them. This change is worth a closer look, because it says a lot about where the value of data may also come from.

What happened

The Sentinel-3 satellite, part of Europe’s Copernicus programme, keep constant watch over land, oceans and atmosphere. Among the many things its instruments can pick up are active fires.

Until recently, its data reached users within three hours of being captured. This acquisition time is perfectly adequate for most of its observation purposes. For a fire moving through dry countryside in August, it is not. Three hours can separate a contained incident from a much larger one.

So, the teams at ESA and Eumetsat, who operate the mission together, went looking for a way to speed things up. In August they announced the result: images taken over central and southern Europe now arrive in 60 to 90 minutes. Up to three times faster than before, this change has been in regular use in orbit since the beginning of August.

The timing was no accident. Between the first of May and mid-August, the rapid mapping service of the Copernicus Emergency Management Service had been activated 41 times for wildfires in Europe (as of 17 August). When a fire broke out east of Belgrade, in Serbia, the new approach delivered data over the area within about an hour.

What did not change

Here is the part we find most interesting: nothing changed in space.

No new satellite was launched. No instrument was upgraded. The measurements are exactly the ones the mission was already taking. What changed is the delivery. Simplifying a little: Sentinel-3 gathers data as it orbits and sends it down in one go when it passes within reach of the Svalbard ground station, in Norway, with the oldest data transmitted first.

Under the old routine, there was a cut-off: everything captured after the satellite came into view of the antenna, roughly as it flew over northern Germany, had to wait for the next pass. Which meant that the freshest images of Europe, taken on the way north, were exactly the ones arriving last.

The teams reworked this routine so that the satellite now does two things at once while the antenna is in sight: it keeps downloading the data from its completed orbit, and at the same time it transmits what it is capturing at that very moment. The newest data over Europe no longer waits its turn.

For someone coordinating a response on the ground, this procedural change makes the whole difference. A fire map that arrives within the hour is a great support for decisions.

The lesson travels well beyond fires

It is tempting to think that the value of data only lives in the instrument: the satellite, the sensor, what it can measure and how precisely. This story suggests something different. A good part of the value lives in the route between the measurement and the person who has to act on it. Improve the route, and the same data is suddenly worth more. In this case, three times more.

Emergency response makes this visible, because there the useful window is measured in minutes and hours. But every field has a window of its own: a span of time within which information can still change a decision, and after which it can only describe what happened. A farm deciding when and where to irrigate has days. A city planning where to add green areas has a budget cycle. An authority tracking coastal change has a season. The scale changes, the logic does not: in every case, the question is not only what the data shows, but whether it reaches the right desk while the decision is still open. A fire map that arrives within the hour can still shape a decision. The same map, three hours later, mostly records one that has already been made.


This article is part of EOReach, an initiative by Progressive Systems to bring Earth Observation data, tools and knowledge into any application domain. If you are interested in exploring how EO data can support your domain, you can contact us at info@earthconsole.eu. 


Source: https://www.esa.int/Applications/Observing_the_Earth/Copernicus/Sentinel-3/Sentinel-3_provides_faster_data_for_Europe_fires

Image credit: contains modified Copernicus Sentinel data (2026), processed by ESA.
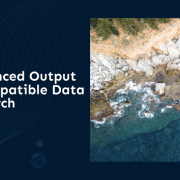
Presentation slide about satellite altimetry research, featuring the title ‘ALES Evolves: Enhanced Output using FDR4ALT-Compatible Data for Altimetry Research.’ The slide includes a dark blue scientific design and an aerial view of a rocky coastline and turquoise sea, representing Earth observation, coastal monitoring, and remote sensing technologies.

ALES Evolves: Enhanced Output using FDR4ALT-Compatible Data for Altimetry Research

We are pleased to announce a significant upgrade to the ALES (Adaptive Leading Edge Subwaveform) services for ENVISAT and ERS-2 missions. Developed by Marcello Passaro from the Deutsches Geodätisches Forschungsinstitut (DGFI) of the Technical University of Munich, this release brings an optimized output product designed to streamline research workflows.

This enhancement adds to a previous update that introduced compatibility with the ESA FDR4ALT (Fundamental Data Records for Altimetry) datasets. Together, these improvements provide a strong combined benefit for the scientific community working on altimetry projects.

What’s new

The focus of this release is the optimization of the ALES output product.

We know that managing large datasets can be a burden, so the new ALES version for ERS-2 and ENVISAT now integrates all relevant parameters from the input products directly into the final ALES output file1.

This means you no longer need to download or store bulky input datasets. Everything you need for your analysis is contained within the result file, making your data handling much lighter and faster.

Adding to existing FDR4ALT compatibility

This update leverages the previously introduced compatibility with FDR4ALT-generated datasets. The ESA FDR4ALT project was specifically designed to reprocess historical observations and bring them to a superior performance level for long-term time series.

This provides two main benefits for long-term oceanographic studies:

  • Enhanced Data Reliability: the combination of ALES retracking with FDR4ALT’s improved instrumental corrections ensures higher standards of data quality for coastal and open-ocean applications.
  • Multi-Decadal Continuity: this update facilitates the creation of high-quality time series spanning from 1995 (ERS-2) through 2012 (ENVISAT), which is essential for detecting climate trends and sea-level variations over decades.

The ALES Methodology: why it matters for Coastal Research

If you are new to the ALES processor2, it is important to understand why it has become widely used within the altimetry community.

Standard altimetry products often provide degraded performance as the satellite approaches the coastline. This is primarily due to land interference “polluting” the radar echo (waveform), which results in significant noise or data gaps.

ALES addresses these limitations through two specific innovations:

  • Subwaveform Retracking: unlike traditional retrackers that analyze the full radar echo, ALES focuses exclusively on the leading edge. By isolating a selected portion of the waveform containing the leading edge of the signal, the algorithm ignores the noisy “tail” caused by land interference or the glare caused by extremely calm water, retrieving valid sea-level measurements in areas where standard retrackers typically fail.
  • Adaptive Windowing: the algorithm dynamically adjusts its analysis window based on the significant wave height (SWH). This adaptive approach ensures high-precision measurements across varying sea states, maintaining consistency from the open ocean to within a few kilometers of the shoreline.

How to access the services for free

The ALES for ERS-2 and ENVISAT services are hosted within the ESA Heritage Missions Virtual Lab (HMVL) on EarthConsole®. The HMVL is an ESA initiative dedicated to the valorization of data from missions which are no longer operational in space.

You can choose the mode that best fits your workflow:

  • On-demand Processing: full control of your runs and its parameters through an intuitive Graphical User Interface (GUI).
  • Bulk Processing: let EarthConsole® operators handle large-scale data processing based on your specific requirements.

Access to the processing services is provided through the following steps:

Additional processing time (up to another 100 hours) can be requested subject to ESA approval. For large-scale processing requirements exceeding 200 hours, support may be available through the ESA Network of Resources (NoR) sponsorship.

For further clarification or support, please contact us info@earthconsole.eu. We would be happy to help.


1 It is important to note that in its current version, ALES for ENVISAT FDR4ALT does not implement a variable tracking gate as according to the section 6.2.8 of the FDR4ALT User Guide and therefore may show offsets in a small fraction of data for cycles 14,15 and 20.

2 References: Passaro, M., et al. (2014). ALES: A multi-mission adaptive subwaveform retracker for coastal altimetry. Remote Sensing of Environment. Read the paper here. 

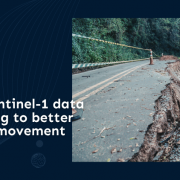
EarthConsole Stories banner about Copernicus Sentinel-1 satellite data and machine learning for ground movement monitoring, featuring a landslide-damaged forest road with cracked and collapsed asphalt.

EarthConsole® Stories: using Copernicus Sentinel-1 data and machine learning to better understand ground movement

EarthConsole® Stories are experiences about how we helped universities, research centres or service developers to leverage Earth Observation data to extract valuable insights for their research, educational or pre-commercial projects.

The Project

Understanding how and why the ground moves is essential for managing natural resources, infrastructure, and environmental risks. This research project, developed at Politecnico di Torino, focuses on improving the detection and interpretation of ground deformation through innovative data analysis methods.

To achieve this, the study uses machine learning techniques to analyse large amounts of data over time, with the objective of automatically identifying patterns and grouping together areas that behave in a similar way.

A key goal is to better understand what drives ground deformation behaviour, with a specific focus on human-induced activities such as water extraction.

By studying these factors across a range of environments, the project seeks to build a completer and more reliable picture of how and why deformation occurs.

This work is part of the first Italian National PhD programme on Sustainable Materials, Processes, and Systems for Energy Transition, established under the National Recovery and Resilience Plan.

The Need

The project required reliable satellite data to monitor subtle ground movements over time. Access to Sentinel-1 C-band radar imagery was essential, as it provides consistent observations regardless of weather or lighting conditions, making it ideal for continuous monitoring.

Another key requirement was the use of DInSAR techniques, which compare satellite images taken at different times to measure how the ground has moved, making it possible to produce consistent and comparable time series to be used as input for the project processing chain.

Why EarthConsole®

EarthConsole® was selected because it provides access to the P-SBAS on-demand service for Sentinel-1, which implements a DInSAR technique developed by CNR-IREA. This service enables efficient processing of Sentinel-1 C-band data, offering the possibility to compute displacement time series and the corresponding mean deformation velocity map with centimeter to sub-centimeter accuracy.

Reflecting on the experience, the project coordinator shares:

The ability to process Sentinel-1 data on demand, without relying on local infrastructure, has enabled us to focus on interpreting results rather than managing complex workflows. The platform allows us to easily generate deformation time series over our areas and periods of interest, aligned with the availability of ancillary data. Its fast processing capabilities and user-friendly interface have been essential for efficiently exploring a range of study cases.

Alberto Manuel Garcia Navarro, PhD Student, Politecnico di Torino – Italy


The Impact

This project contributes to advancing how ground movement is monitored and understood, with important benefits for both science and society. By making it easier to detect and interpret deformation patterns, it supports more informed decision-making in areas such as infrastructure management, environmental protection, and energy systems..

This project has been supported via the ESA Network of Resources initiative.


Banner including blog title "EarthConsole® Stories: Improving Discharge Estimation in Rivers of Mediterranean Countries" and a picture of a river.

EarthConsole® Stories: Improving Discharge Estimation in Rivers of Mediterranean Countries

EarthConsole® Stories are experiences about how we helped universities, research centres or service developers to leverage Earth Observation data to extract valuable insights for their research, educational or pre-commercial projects.

The Project

The DEMETRAS initiative, part of the broader ESA 4DMED-Hydrology project, aims to deliver more accurate and timely insights into river discharge in Mediterranean countries. By leveraging both satellite altimetry and optical data, the project aims at improving how water flow is measured and monitored in the region.

4DMED-Hydrology focuses on developing an advanced reconstruction of the Mediterranean terrestrial water cycle with high resolution and consistency. It does so using cutting-edge Earth Observation (EO) data from ESA Copernicus missions. The project targets four key river basins — the Po in Italy, Ebro in Spain, Hérault in France, and Medjerda in Tunisia — each selected for their diverse climates, landscapes, land uses, and vulnerability to water-related hazards.

The Need

To improve the accuracy of river discharge estimates, the DEMETRAS research team needed advanced tools for processing Earth Observation data. The team aimed to track water levels along rivers over time by using measurements taken at various locations by different satellites on different orbits. This approach would allow to build reliable time series of how river levels rise and fall, which is essential for understanding water resources.

A key challenge was monitoring water levels in narrow rivers, that are typically difficult to capture using standard satellite measurements. To address this, the research team sought to apply Fully-Focused Synthetic Aperture Radar (FF-SAR) techniques within altimetry missions, which can deliver precise measurements for rivers only a few tens of meters wide.

Why EarthConsole®

To meet these needs, the DEMETRAS team chose the ARESYS Fully-Focused SAR processor, available through the Altimetry Virtual Lab on EarthConsole®. With it, they could process Sentinel-3 data in fully-focused SAR mode across multiple years (2016 to 2022) in Northern Italy and assess the value of this advanced processing technique within the project’s framework.

The processed datasets proved useful to overcome the challenges of our research. Leveraging the ARESYS Fully-Focused SAR processor through EarthConsole® allowed us to conduct bulk processing of a long-term Sentinel-3 dataset spanning 2016–2022, which was managed by the EarthConsole® operators. This relieved the project team from the complexities of processing chain setup and infrastructure management, so we could just focus on the science and analysing the results.

Christian Massari, Academic Researcher, CNR-IRPI – Italy


The Impact

The DEMETRAS project is set to make a strong contribution to both the scientific community and stakeholders across the Mediterranean. By delivering more accurate and temporally detailed water level data, it will strengthen the reliability of hydrological models that support water resource planning and flood risk assessment.

Additionally, the project’s results are being shared openly through platforms like Zenodo, ensuring that researchers, policy-makers, and practitioners across the region can benefit. This knowledge sharing will help communities better understand and respond to the water-related challenges they face.

This project has been supported via the ESA Network of Resources initiative.


Banner titled "EARTHCONSOLE® Stories" featuring the project "Supporting Coastal Climate Change Research in Kerala." The left side includes a logo and text indicating coordination by NERSC (Nansen Environmental Research Centre). The right side displays a coastal scene with a beachfront town in Kerala.

EarthConsole® Stories: Supporting Coastal Climate Change Research in Kerala

EarthConsole® Stories are experiences about how we helped universities, research centres or service developers to leverage Earth Observation data to extract valuable insights for their research, educational or pre-commercial projects.

The Project

Coastal regions are on the frontline of climate change, and the coast of Kerala, South India, is no exception. It’s one of the most densely populated shorelines in the region—and one of the most vulnerable.

The Climate Change impact on the marine Coastal ecosystem of Kerala (C3-eKerala) project, funded by The Research Council of Norway, aims to improve the understanding of coastal sea-level variations by integrating multiple Earth Observation data sources. These include tide gauge measurements, radar altimetry data from several nadir-looking satellite altimeters, and high-resolution observations from the new SWOT (Surface Water and Ocean Topography) satellite mission.

Picture of the consortium of the eKerala project.Picture of the C3-eKerala project consortium.

By combining traditional and advanced satellite monitoring techniques, the project seeks to evaluate the reliability of satellite-based sea-level observations along the coastal zone of Kerala, before using them to quantify the contribution of winds and ocean warming to local sea level variations in the region.

The Need

This project aims to show how satellite data can effectively monitor changes in sea level along the coast of Kerala, India. To start with, the team needs to compare satellite measurements with data from a sea-level monitoring station in Kochi to check how accurate the satellite readings are. To improve the quality of the data, they also need to test different ways of averaging the satellite results, evaluate the performance of individual satellite missions, and assess how the ability of satellite altimeters to reconstruct sea-level improves when multiple missions are combined.

In the next phase of the project, the team will focus on testing data from a new satellite mission called SWOT (Surface Water and Ocean Topography). They’ll compare it with existing sea-level data to see how well it works. To make sure the comparisons are fair, they need to carefully match up the different types of data.

To understand why sea levels are changing, the project will also look at ocean temperature data from satellites and measurements from floating sensors called Argo floats. This information will go into a model that helps explain how ocean warming and winds affect sea level.

Why EarthConsole®

To support the goals of the C3-eKerala project, the team selected the EarthConsole® P-PRO service, a solution tailored for large-scale satellite data processing. This service was essential for handling the extensive volume of radar altimetry data required for the project, enabling efficient reprocessing of long-term datasets.

The P-PRO service allowed the team to process Sentinel-3, CryoSat-2 and ENVISAT radar altimetry data, spanning from 2012 to 2022, using the ALES+ SAR and ALES retrackers, specialized processors developed by the Technical University of Munich optimized for calculating sea level height. Access to these advanced processors, available via the ESA Altimetry and Heritage Missions Virtual Labs on EarthConsole®, will support the team in generating high-quality data aligned with their need for accurate coastal sea-level monitoring

Picture of Fabio Mangini. Photo: Nansen Center

EarthConsole® provided the tools and flexibility we needed to handle large volumes of data and generate reliable coastal altimetry outputs—specifically tailored for shoreline environments—which were crucial for the first phase of our research.

Fabio Mangini’s photo: Nansen Center.

The Impact

The impact of the C3-eKerala project will be far-reaching. By validating and enhancing satellite-derived sea-level measurements, it lays the groundwork for more reliable monitoring of climate change impacts in coastal areas. The insights from this project are expected to feed into Kerala’s State Action Plan on Climate Change (2023–2030), helping shape policies and response strategies for one of India’s most vulnerable coastal regions.

This project has been supported via the ESA Network of Resources initiative and the Heritage Missions Virtual Lab.


A promotional banner for the 'BeGEO Scientists Webinar' on April 9, 2025, from 15:30 to 17:00 CEST. The webinar focuses on 'InSAR and P-SBAS applications in Earth Sciences' and the 'EarthConsole® platform for assisted processing of large Earth Observation datasets.' The banner has a yellow background with blue text and logos of supporting organizations, including BeGEO Association, EarthConsole®, Progressive Systems, and IREA-CNR.

Join the 3rd BeGEO webinar on InSAR and P-SBAS applications in Earth Sciences

We’ve teamed up with the BeGEO Association and the Italian Istituto per il Rilevamento Elettromagnetico dell’Ambiente (IREA-CNR), to bring you the 3rd BeGEO webinar entitled “InSAR and P-SBAS applications in Earth Sciences. The EarthConsole® platform for the assisted processing of large Earth Observation datasets”.

The webinar will be held on April 9, 2025, from 15:30 to 17:00 (CEST).


Why this webinar?

Interferometric Synthetic Aperture Radar (InSAR) is a powerful technique that allows for the analysis of Earth’s surface motions caused by both natural and anthropogenic processes. However, the processing of large SAR datasets needs large in-house processing resources.

That’s where EarthConsole® steps in.

EarthConsole® is Progressive Systems’ cloud-based platform that helps institutions, researchers, and developers create, test, and host applications and processors, enabling simplified access to Earth Observation data and processing services. By co-locating computing resources with data archives, the platform ensures faster and more efficient data processing.

During the webinar we present an overview of the InSAR theory and show the application of the P-SBAS on-demand service for Sentinel-1 (2016–present) and ENVISAT (2002–2012) hosted on the EarthConsole® platform to produce time-series of incremental ground motions and maps of the average velocities. A particular focus will be given to the study of ground deformation caused by both natural and anthropogenic processes. A demonstration will guide participants through the request and practical use of the service, with a particular emphasis on the graphical user interface (GUI) and processing parameters.

At the end of the webinar the attendants will be acquainted with the InSAR principles, as also with the procedure to request the P-SBAS service and process their own data on EarthConsole®.

What’s on the Agenda?

  • 15:30:16:00 – Dr. Claudio De Luca, Researcher at IREA-CNR: Differential SAR Interferometry: Principles, techniques and applications.
  • 16:00-16:20 – Massimo Orlandi, Engineer on Earth Observation projects (Progressive Systems): P-PRO On-Demand P-SBAS service: Live Demonstration
  • 16:20-16:40 – Maddalena Iesué, Communication and Partnerships Manager (Progressive Systems): How to request free access to the P-PRO On-Demand P-SBAS service and Overview of EarthConsole®
  • 16:40-17:00 – Q&A section

Bonus for attendees

Upon request, we will provide attendees with a one-week free trial, including up to 30 processing hours, to test the P-SBAS for Sentinel-1 on-demand service on EarthConsole®. Instructions for making the request will be shared during the webinar.

See you soon online!


This webinar is supported by the ESA Network of Resources Initiative
Image showing a sand dam in Kenya, near terraced farm hills.

EarthConsole® Stories: monitoring sand dams’ impact on water availability with satellite image time-series analysis

EarthConsole® Stories are experiences about how we helped universities, research centres or service developers to leverage Earth Observation data to extract valuable insights for their research, educational or pre-commercial projects.

The Project

Climate change driven by human activity is significantly altering the water cycle at global, regional, and local levels, with these effects expected to intensify in the coming years (Pörtner et al. 2022). In semi-arid regions, prolonged dry periods and high evaporation are already reducing the availability of usable water in river systems, with direct negative consequences for ecosystems and the livelihoods of local communities (Kalele et al. 2021).

Currently, around 1.5 billion people live in semi-arid areas and this number is expected to increase due to shifts in climate zones. To ensure their food security and counteract the impending water shortage, measures are necessary on different spatial and temporal scales. A comparatively simple and cost-effective method is the construction of dams along the flow cross-section of seasonal rivers. These act as natural barriers and within a few years fill up with sediment, in which the water collects and is protected from evaporation and too rapid runoff.

Led by Dr. Andreas Braun from the University of Tübingen, this research project aims to assess the impact of sand dams on water availability in selected African regions. Using time series analysis of satellite images, the study seeks to quantitatively and qualitatively evaluate how sand dams influence their surrounding environments.

The Need

To conduct this research, the research team needed advanced Earth Observation (EO) tools capable of analyzing long-term surface changes around sand dams. These dams gradually alter ground levels, leading to positive environmental effects such as for example increased soil moisture, enhanced vegetation growth, and reduced land degradation.

However, conventional EO approaches often struggle to capture changes in seasonal river systems, requiring the use of indirect indicators like vegetation cover and land-use modifications. To overcome this limitation, the team sought a solution that could track changes through closely spaced time series observations.

Why EarthConsole®

EarthConsole® was selected for its access to the P-SBAS (Parallel Small BAseline Subset) on-demand service for Sentinel-1, provided by IREA-CNR. This service implements an advanced InSAR technique enabling the generation of Earth surface deformation time-series and, more generally, interferometric products through an intuitive graphical user interface (GUI). The GUI allows the user to select SAR data for specific areas and time periods, set processing parameters, and download processing results autonomously.

Reflecting on his experience, Dr. Braun shared:

EarthConsole®’s P-SBAS for Sentinel-1 on demand service has been selected to enrich our research. In addition to Sentinel-2, US Landsat Missions and hyperspectral data such as EnMap, we wanted to explore the potential of Sentinel-1 SAR data to provide new insights into deformations caused by water extraction but also increased storage volume near the identified sand dams.

Dr. Andreas Braun, Academic Researcher, University of Tübingen – Germany


The Impact

This research has the potential to transform the use of sand dams as a climate adaptation strategy. It is based on the hypothesis that sand dams have a positive effect on their environment, but that this effect varies depending on the climate zone and landscape. By incorporating satellite-based monitoring, the project aims to showcase how sand dams can effectively mitigate water shortages, helping local communities build resilience against climate change.

This project has been supported via the ESA Network of Resources initiative.