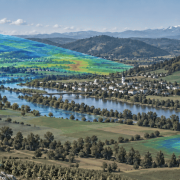
Satellite, drone and ground-based sensors collecting complementary measurements over a European river valley, with highlighted areas showing the different observation scales.

No single source tells the whole story: why satellite data often works best when combined with other observations

Satellite technology is remarkably advanced, so it is tempting to imagine it can see almost anything, anywhere, in perfect detail, at any moment. In reality, satellites have real limits.

Most Earth Observation satellites follow predetermined orbits, which limit when they can observe a particular location. Some can be tasked or pointed towards a target, but acquisitions are still constrained by their orbit, capacity and revisit time. Thick cloud cover can prevent optical instruments from observing the surface, while thinner clouds and haze may reduce data quality. Radar can image the surface through most cloud cover and operate day or night, although intense precipitation can affect some radar observations, depending on the wavelength and application. Satellite instruments also generally involve trade-offs between spatial detail, coverage and revisit frequency: a single sensor cannot provide the finest detail, the widest coverage and the most frequent observations all at once.

This is why satellite data is often combined with measurements taken on the ground or from other observing systems, including ground stations, buoys, weather balloons, aircraft and other sensors. Each source provides a different kind of information. Local observations can reveal details that a satellite may not capture, while satellites are particularly valuable for providing broad, repeated and relatively consistent observations across entire regions.

What follows are examples of the same principle: other sources can help validate satellite-derived information, fill observation gaps or provide the context needed to interpret what a satellite detects.

Satellite and ground station: wide coverage, verified on the spot

Soil moisture is a good example.

Satellites can estimate moisture levels across extensive areas, including places where installing and maintaining instruments on the ground would be difficult. This broad and consistent coverage is one of their main advantages.

A satellite measurement, however, is not the same as placing a sensor directly in the soil. Satellite soil moisture products are derived from signals recorded by the instrument and processed through models. Their accuracy is therefore assessed through comparisons with in-situ measurements, field campaigns and other reference datasets, while accounting for the very different spatial scales involved.

Networks of ground stations remain essential for validating satellite products and improving the methods used to derive soil moisture estimates.

The satellite supplies broad coverage; the stations provide local, in-situ measurements.

Satellite and drone: complementary views during emergencies

During an emergency, the timing of an observation can be as important as its resolution.

Optical satellites cannot observe the surface through thick cloud cover. Radar satellites can, although their imagery has a different geometry and provides a different type of information that may not be suitable for every assessment.

Aircraft and drones can sometimes help. They can be deployed more flexibly and, in suitable conditions, collect very high-resolution imagery below the cloud layer, provided visibility and flight conditions remain suitable. The Copernicus Emergency Management Service has also introduced an aerial component to complement satellite-based mapping in selected emergencies.

Aircraft and drones, however, are not available in every situation. Their use depends on weather, visibility, safety, local regulations and the time needed to organise a flight. Drones, in particular, may be unable to operate in heavy rain or strong winds, the very conditions that often cause the emergency in the first place.

Still, when conditions permit, aerial observations can fill an important gap. In a rapidly changing emergency, an image delivered while decisions are being made may be considerably more useful than one acquired after the situation has changed, without ever reducing the value of the satellite’s own, wider view of the same event.

Satellite and organisation: scale meets context

Not every useful source belongs to a scientific monitoring network. Organisations already hold information that can change how satellite observations are interpreted.

A farm may have records of irrigation, crop varieties and previous yields. A water utility knows how much water it pumped, from which infrastructure and at what time. An infrastructure operator may hold records on the location, condition and maintenance history of roads, pipelines, railways or other assets.

Satellite observations can show patterns across a large area, such as changes in vegetation, surface temperature, soil moisture or ground stability. Internal records help explain what was happening on the ground at the same time.

A change in vegetation observed from space may be linked to water stress, but irrigation records, field observations and weather data can help investigate why it occurred. For an infrastructure operator, information on ground movement or flooding becomes more useful when it can be connected to the location and condition of specific assets.

Satellite data provides scale and consistency; operational data can supply the local context needed to interpret it and decide what to do next.

Sharper satellites, same need for company

Satellite imagery is becoming more detailed and, in many cases, more frequent. Copernicus, the European Union’s Earth Observation programme, complements Sentinel data with observations from contributing missions operated by commercial providers, ESA Member States and other international partners, including high- and very-high-resolution optical and radar missions.

These developments are closing some observation gaps. A growing constellation may revisit an area more often, while a higher-resolution instrument can reveal features that older missions could not detect.

Better imagery does not, however, make ground measurements, aerial surveys or operational records redundant. A sharper image may show where a change occurred, but not necessarily what caused it, whether it affected an organisation’s assets or what response is appropriate.

The aim is therefore to choose the combination of sources that fits the problem.

Reading different data side by side

Combining data is not simply a matter of displaying several datasets on the same screen.

Measurements may cover different areas, represent different moments in time or use incompatible formats and units. A satellite measurement may represent a relatively large area and be updated every few days, while a ground sensor records a single location every few minutes. Both may be accurate, but they are not describing the world at the same scale.

The sources may also have different levels of accuracy and uncertainty. Before they can be used together, these differences have to be understood and taken into account.

This requires suitable processing and knowledge of the phenomenon being monitored. Some steps can be standardised, but the method still has to reflect what the data represents and what decision it is expected to support.

The important question is not simply which satellite can cover a particular case, but which combination of observations can provide the information actually needed. Each example in this article illustrates the same principle: different sources reveal different parts of a problem. Making them work together reliably is a distinct skill, one that sits between the data itself and the decision it is meant to support.


This article is part of EOReach, a Progressive Systems initiative created to bring Earth Observation data, tools and knowledge into a wider range of application domains.

At Progressive Systems, we support this process through EarthConsole®: helping organisations combine satellite observations with other sources of data and turn them into operational digital services for environmental and climate monitoring. If you are working on a similar challenge, we would be happy to discuss it with you. Contact us at info@earthconsole.eu.


Sources

ESA Space Solutions, “Newcomers Earth Observation Guide.” https://business.esa.int/newcomers-earth-observation-guide

ESA Climate Change Initiative, Soil Moisture project. https://climate.esa.int/en/projects/soil-moisture/related-links/

European Commission Joint Research Centre, “Drones and planes: unprecedented imagery resolution for disaster assessment.” https://joint-research-centre.ec.europa.eu/jrc-news-and-updates/drones-and-planes-unprecedented-imagery-resolution-disaster-assessment-2023-09-25_en

ESA, “19 New Space signatures for Copernicus Contributing Missions.” https://www.esa.int/Applications/Observing_the_Earth/Copernicus/19_New_Space_signatures_for_Copernicus_Contributing_Missions
FLEX and Sentinel-3C: watching plants breathe and tracking a changing planet

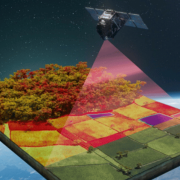
Today, two satellites lifted off together from Europe’s Spaceport in French Guiana. One is there to watch plants breathe. The other will continue monitoring key environmental and climate variables, building on observations collected by its predecessors since 2016.

They will help us better understand the health of vegetation and the wider conditions shaping our changing planet.

Two satellites, one launch

The two satellites are FLEX, a new ESA Earth Explorer mission, and Copernicus Sentinel-3C, the third satellite in Europe’s Sentinel-3 series. They travelled into space aboard the same Vega-C rocket, using a specially designed configuration that allowed them to be released separately.

FLEX: watching plants breathe

FLEX carries FLORIS – the Fluorescence Imaging Spectrometer – an instrument designed to detect something the human eye cannot see: the faint glow emitted by plants as they photosynthesise.
This signal changes according to a plant’s health and growing conditions. It can reveal early signs of stress caused by drought, heat or disease, sometimes before they become visible in a field.

On its own, however, this signal tells only part of the story. To interpret it correctly, scientists also need information about factors such as land-surface temperature, vegetation type, clouds and atmosphere. These are among the variables already measured by Sentinel-3.

Now in space, FLEX will fly in tandem with Sentinel-3A satellite already in orbit, and later on with Sentinel-3C. Together, their measurements are expected to give scientists a far more complete picture of how vegetation is functioning across the planet.

Sentinel-3C: continuing the watch

Copernicus Sentinel-3C, jointly managed by ESA and EUMETSAT, is the third satellite in a series that has been operating since 2016. Its role is not simply to introduce new observations, but to help ensure that an essential monitoring service continues without interruption.

Its instruments support a wide range of applications. They measure sea-surface temperature, ocean colour, wave height, wind and changes across land and ice. These observations may contribute to weather and ocean forecasts, safer navigation, the early detection of harmful algal blooms, and the monitoring of active fires, just to mention a few.

Why long-term observations matter for our changing planet

Across Europe, the effects of a changing planet are becoming increasingly visible through extreme heat, wildfires, prolonged droughts and rising sea levels. The ocean plays a central role in these changes, absorbing roughly 90% of human-driven heat, shielding us from either grater impacts of global warming.

This process is already reshaping currents, ecosystems and weather patterns.

At the same time, around 30 million people in Europe live in coastal flood plains exposed to sea levels rise.

Changes of this scale cannot be understood from a single snapshot. They require the same measurements, collected consistently over many years. This is why keeping the Sentinel-3 series operating without interruption matters.

A single observation can tell us what is happening today. A long, continuous record can help a coastal community, fishing fleet or planning authority understand whether a particular year was unusual or whether it signals a lasting shift.

And through the Copernicus programme, much of this data is made freely available, often within hours of being collected, so that researchers, public authorities, businesses and other organisations can turn observations from space into practical information.

This article is part of EOReach, a Progressive Systems initiative created to bring Earth Observation data, tools and knowledge into a wider range of application domains.

Through our EarthConsole® platform, we help researchers, public authorities, businesses turn data and analytical models into operational digital services for environmental and climate monitoring. If you would like to explore how Earth Observation data could support your work, contact us at info@earthconsole.eu.

Image credit: ESA/ATG medialab


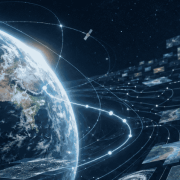
Earth surrounded by layered satellite imagery and geospatial data, with a luminous path emerging through the complexity.

So much Earth Observation data, so hard to choose

The people we have been working with most closely are researchers: scientists who use Earth Observation data professionally, some for their entire careers. If anyone should feel at home navigating this domain, it is them.

Yet the difficulty they have been describing to us, more and more often, has nothing to do with a lack of data or a lack of skill. It comes down to orientation: knowing which of the many satellite missions carries the measurement they need, on which platform it lives, in what format, under what conditions. The information exists. Finding it has turned into a task of its own.

That tells the rest of us something. If people who work with Earth Observation data every day find this hard, imagine someone approaching satellite data for the first time, with no idea where to start. So when a company or a public administration looks at this world and feels lost, that is not a sign of falling behind. It is an accurate read of how complicated the Earth Observation data landscape has gotten.

The Earth Observation data landscape really has grown

A few numbers, so this doesn’t stay just an impression.

According to the 2024 edition of the Earth Observation Satellite Systems report by Novaspace, a space-sector market intelligence firm, around 1,900 Earth Observation satellites were launched in the decade to 2023, and the forecast for the following decade (2024 – 2033) is roughly 5,400, nearly three times as many. Each new satellite mission brings its own instruments, its own data products and archives, and usually its own way of accessing them.

Access to satellite data itself has opened up a lot, at least in Europe. Most of the data and information produced by Copernicus, the EU’s Earth Observation programme, is available to anyone in the world, free of charge and without restriction. Since June 2024, European rules also require public bodies to publish key categories of geospatial data, from environmental to meteorological and mobility data, at no cost and in machine-readable formats.

All of this adds real value to the Earth Observation ecosystem. It also adds one more door to keep track of.

What all those doors lead to

Behind those doors sits a surprising amount of possibility, and a lot of it costs nothing to access.

A municipality can use Earth Observation data to track how heat builds up across its streets and plan green spaces accordingly. A farm can use satellite data to catch water stress in a field before it shows to the eye. Someone monitoring railway infrastructure can use remote sensing to pick up ground movement of a few millimetres a year. None of this is hypothetical, it is what Earth Observation data already allows today.

Which is precisely why struggling to find your way through it matters. If there were little on offer, getting lost wouldn’t cost much. The more this landscape has to give, the more expensive it gets to not know how to navigate it.

How the industry is tackling satellite data fragmentation

The organisations that produce and manage Earth Observation data see the same problem, and several are trying to do something about it.

In Europe, the clearest example is the Copernicus Data Space Ecosystem, launched in 2023 as the official gateway to Copernicus satellite data. One place to search, view, download and process satellite data, replacing a handful of earlier access points, now hosting tens of petabytes of data for a community of hundreds of thousands of registered users.

ESA is pursuing a different route toward the same goal. Its Common Architecture initiative, known in the sector by its technical name EOEPCA+, starts from much the same observation as this article: that the ecosystem of Earth Observation platforms has become fragmented, leaving users with too much to evaluate on their own. Instead of gathering everything under one roof, the initiative works on shared technical standards, developed together with the sector’s main standards body (the Open Geospatial Consortium), so that tools and platforms built by different providers can still work together instead of locking users into one system.

Why navigating satellite data matters as much as having it

Put the growth of the landscape and these efforts to organise it side by side, and a pattern emerges: access to satellite data is no longer the main obstacle, at least not for most of what this article has described. What makes the difference is the ability to navigate it well, to connect one specific question to the right sources out of thousands.

What should that navigation look like, going forward? A single gateway is one answer. Common standards are another. Someone who deeply knows the Earth Observation terrain and can guide you through it might be a third. It will probably take some mix of all of them. In the meantime, we’re curious to hear, where do you get lost in the Earth Observation data domain?

This article is part of EOReach, an initiative by Progressive Systems to bring Earth Observation data, tools and knowledge into any application domain. If you are interested in exploring how EO data can support your domain, you can contact us at info@earthconsole.eu. 

Sources

How Europe’s fire data got three times faster, without a single new satellite

This summer, while large areas of countryside in many European countries dealt with wildfires, something changed in the way satellite data reaches the people who respond to them. This change is worth a closer look, because it says a lot about where the value of data may also come from.

What happened

The Sentinel-3 satellite, part of Europe’s Copernicus programme, keep constant watch over land, oceans and atmosphere. Among the many things its instruments can pick up are active fires.

Until recently, its data reached users within three hours of being captured. This acquisition time is perfectly adequate for most of its observation purposes. For a fire moving through dry countryside in August, it is not. Three hours can separate a contained incident from a much larger one.

So, the teams at ESA and Eumetsat, who operate the mission together, went looking for a way to speed things up. In August they announced the result: images taken over central and southern Europe now arrive in 60 to 90 minutes. Up to three times faster than before, this change has been in regular use in orbit since the beginning of August.

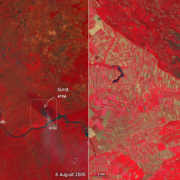
The timing was no accident. Between the first of May and mid-August, the rapid mapping service of the Copernicus Emergency Management Service had been activated 41 times for wildfires in Europe (as of 17 August). When a fire broke out east of Belgrade, in Serbia, the new approach delivered data over the area within about an hour.

What did not change

Here is the part we find most interesting: nothing changed in space.

No new satellite was launched. No instrument was upgraded. The measurements are exactly the ones the mission was already taking. What changed is the delivery. Simplifying a little: Sentinel-3 gathers data as it orbits and sends it down in one go when it passes within reach of the Svalbard ground station, in Norway, with the oldest data transmitted first.

Under the old routine, there was a cut-off: everything captured after the satellite came into view of the antenna, roughly as it flew over northern Germany, had to wait for the next pass. Which meant that the freshest images of Europe, taken on the way north, were exactly the ones arriving last.

The teams reworked this routine so that the satellite now does two things at once while the antenna is in sight: it keeps downloading the data from its completed orbit, and at the same time it transmits what it is capturing at that very moment. The newest data over Europe no longer waits its turn.

For someone coordinating a response on the ground, this procedural change makes the whole difference. A fire map that arrives within the hour is a great support for decisions.

The lesson travels well beyond fires

It is tempting to think that the value of data only lives in the instrument: the satellite, the sensor, what it can measure and how precisely. This story suggests something different. A good part of the value lives in the route between the measurement and the person who has to act on it. Improve the route, and the same data is suddenly worth more. In this case, three times more.

Emergency response makes this visible, because there the useful window is measured in minutes and hours. But every field has a window of its own: a span of time within which information can still change a decision, and after which it can only describe what happened. A farm deciding when and where to irrigate has days. A city planning where to add green areas has a budget cycle. An authority tracking coastal change has a season. The scale changes, the logic does not: in every case, the question is not only what the data shows, but whether it reaches the right desk while the decision is still open. A fire map that arrives within the hour can still shape a decision. The same map, three hours later, mostly records one that has already been made.


This article is part of EOReach, an initiative by Progressive Systems to bring Earth Observation data, tools and knowledge into any application domain. If you are interested in exploring how EO data can support your domain, you can contact us at info@earthconsole.eu. 


Source: https://www.esa.int/Applications/Observing_the_Earth/Copernicus/Sentinel-3/Sentinel-3_provides_faster_data_for_Europe_fires

Image credit: contains modified Copernicus Sentinel data (2026), processed by ESA.