Five questions on what ground deformation data from space can and cannot tell managers of territories and infrastructures
Imagine a road that needs repeated repairs, and reports from the same neighbourhood that keep arriving over several years. There are inspection notes, photographs and maintenance records, but some questions stay open. Has the ground moved beyond the places already inspected? How has it moved over time? Is there any record from before the first report?
The ground can move so slowly that the change goes unnoticed for years. Inspections and ground sensors tell you a lot about the places they cover, but they can’t be everywhere. Radar satellites can help. They are widely used to observe this kind of movement, and they give you a wide view of an area, repeated over time. As a first screening, they help you spot the places that deserve a closer look.
A technique often used is called InSAR, short for Interferometric Synthetic Aperture Radar. It compares radar images of the same area taken at different times, and the differences show tiny shifts of the ground. You may hear about two main ways to use it: comparing just two images to see a single change (DInSAR) or analysing long series of images over months or years (such as PSI or SBAS) to trace how movement evolves over time.
This technique is used to follow several kinds of ground movement, caused by natural or human-induced events such as:
- Groundwater extraction
- Landslides, tracking continuous, long-term movement
- Volcanic activity
- Earthquakes, by comparing images from before and after the event.
These five questions cover what satellite data can answer in cases like this, and where it stops.
1. Where is the ground moving?
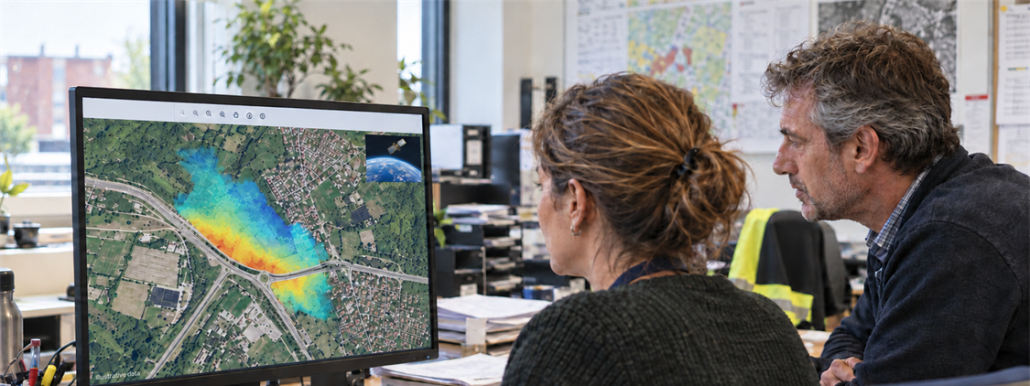
Start with the simplest question: which areas are stable over the period analysed, which are not, and how fast are they moving? A displacement map helps show this over a wide area at once, and without installing anything on site.
Radar satellites look at the Earth at an angle, measuring movement along their direct line of sight (towards or away from the satellite sensor).
Because of this, a single satellite view cannot immediately separate vertical from horizontal movement. Telling them apart needs extra information, for example ground measurements such as GNSS (Global Navigation Satellite System).
The level of detail also depends on the satellite used:
- Wide-area screening data (like Sentinel-1, using C-band radar) is well suited to a first look at whole cities, for example.
- High-resolution commercial data (for example, from X-band satellites) gives more detail, which allows a closer look at specific assets, such as buildings or bridges.
What satellite radar needs is a stable signal: the ground surface must look similar from one image to the next. Vegetation, dense forests, snow, or seasonal freeze-and-thaw can disturb the signal, making movement harder to track in rural or alpine areas compared to urban environments.
2. How fast, and is it speeding up?
Data collected over time shows how a movement developed. Two places that move by the same amount in a year can still tell very different stories. Imagine that in one place the movement is steady. In the other, the ground stays still for months and moves only in the last few weeks. The yearly total is the same, but the story is different. A change of speed is a sign that deserves a closer look.
An important reason to look at many images over time is the atmosphere. Radar sees through clouds, but changes in air temperature, pressure and humidity slow the radar signal by slightly different amounts from one day to another. This atmospheric delay can make the ground look like it moved when it didn’t: a bit like looking at a coin at the bottom of a swimming pool: the moving water makes the coin look like it is shifting, even though it stays still.
A real ground movement tends to persist or evolve consistently across a time series, while atmospheric effects vary between acquisitions. By analysing many observations together, these effects can often be identified and reduced.
3. Can we look back before the first report?
In some places, yes. Satellite archives act as a time machine, letting you check whether ground movement started before a construction project, an excavation or a natural event.
Two of the missions that make this historical view possible are:
- Sentinel-1 (from 2014 to present):the first space mission of the Copernicus constellation, developed by the European Union and the European Space Agency (ESA), providing a long and regularly updated archive of radar observations.
- Envisat (2002–2012): an earlier ESA mission that captured a full decade of historical data.
While there is a two-year gap between these two missions (2012–2014) and the data sources are different, comparing the two separate time periods gives valuable insights into how an area behaved over more than two decades. Historical data shows that the ground was moving, but local context is still needed to confirm why.
4. Does movement mean there is structural damage?
Not necessarily. Movement is a physical measurement, not a structural diagnosis. The satellite detects that the surface has shifted, but not the root cause or the health of the structure. Ground can move due to natural geology, water table fluctuations, slope instability or events like earthquakes.
To interpret satellite data correctly and determine if movement poses a real risk, satellite maps must be combined with local geology, engineering records and site inspections.
Satellite data guides where to inspect; domain experts decide what action to take.
5. What about a sudden event?
After a sudden event such as an earthquake or landslide, radar observations from before and after the event can help map where the surface changed or moved, although very large or abrupt changes can sometimes make the radar signal harder to compare.
An any case if these maps show what has already happened; not what is expected to happen.
Is it right for your case, and where should you start?
Radar satellite monitoring is a strong fit when you need:
- A wide-area overview to prioritize where to perform detailed inspections
- All-weather monitoring, day or night, through clouds
- Historical context to see if movement is new or long-standing
Tell us about your area of interest, the decisions your team faces, or the challenges you are currently investigating. A location, period of interest and a brief description of your question are all we need to start.
Contact us at info@earthconsole.eu.
This article is part of EOReach, a Progressive Systems initiative created to bring Earth Observation data, tools and knowledge into a wider range of application domains.
At Progressive Systems, we support this through EarthConsole®: helping organisations combine satellite observations with other sources of data and turn them into operational digital services for environmental and climate monitoring.
Sources
- ESA, “10 ways Sentinel-1 data lets us ‘see’ our world” (2024): https://www.esa.int/Applications/Observing_the_Earth/Copernicus/Sentinel-1/10_ways_Sentinel-1_data_lets_us_see_our_world
- F. Casu, S. Elefante, P. Imperatore, I. Zinno, M. Manunta, C. De Luca and R. Lanari, “SBAS-DInSAR Parallel Processing for Deformation Time-Series Computation,” IEEE JSTARS, 2014, doi: 10.1109/JSTARS.2014.2322671
- SentiWiki (Copernicus / ESA), “Sentinel-1 Mission Overview, Applications and InSAR”: https://sentiwiki.copernicus.eu/web/s1-mission
- ASF (Alaska Satellite Facility), “Sentinel-1 InSAR Product Guide”: https://hyp3-docs.asf.alaska.edu/guides/insar_product_guide/
- ASF, “Introduction to SAR”: https://hyp3-docs.asf.alaska.edu/guides/introduction_to_sar/
- ESA Earth Online, “Envisat ASAR data collection”: https://earth.esa.int/eogateway/catalog/envisat-asar-im-single-look-complex-l1-asa_ims_1p-
- ESA, “Ground displacement following Venezuela earthquakes”: https://www.esa.int/ESA_Multimedia/Images/2026/07/Ground_displacement_following_Venezuela_earthquakes
- eoPortal, “Envisat”: https://www.eoportal.org/satellite-missions/envisat
- ESA Knowledge Hub, “The Radar Bands” (for X-band and higher resolution): https://knowledge-hub-gda.esa.int/training_resource/the-radar-bands/